
Published Sep 21, 202621 min read
AI Governance: The Control Plane Behind Every Tool Call Your Agents Make
Vinkius AI Governance: the control plane that attributes every MCP tool call to an identity, shields data in flight, budgets agent spend and seals a hash-chained audit receipt for the regulator, the finance team, and the 3 a.m. page.

By Renato Marinho
Founder · Vinkius
Six months ago I was still watching teams demo agents. Now I watch agents that act. Somewhere in between, the center of gravity of agentic infrastructure moved from "can the model do the task" to "can you survive the moment the model stops answering and starts doing." A tool call is a write to the world. An email goes out. A row updates. An order places. A file deletes. The thing that decides is probabilistic, and the thing that executes is not. Every incident in agentic systems lives in that gap, and this post is about how to close it.
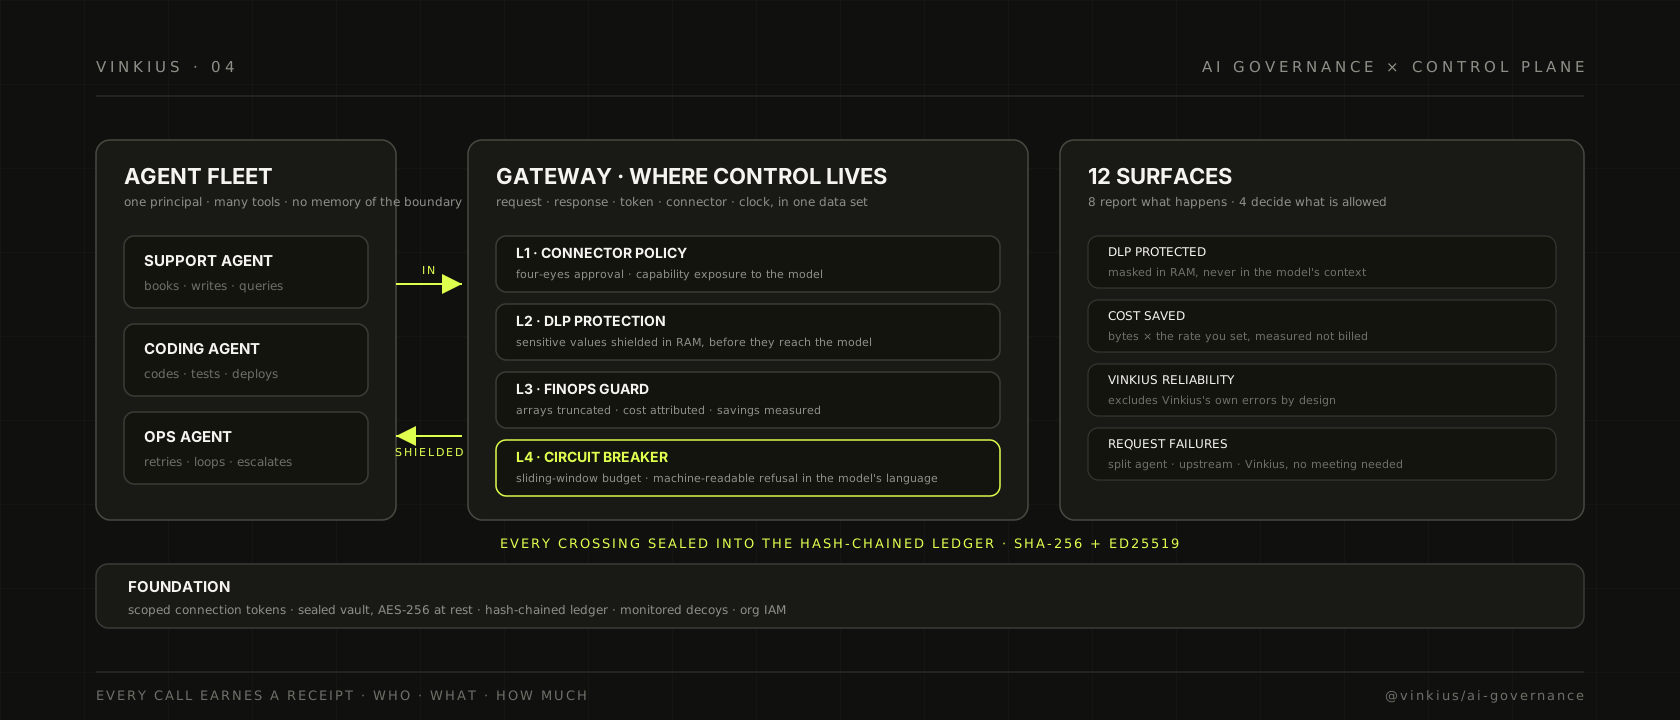
I built Vinkius around one conviction: a cloud for AI agents is only finished when you can answer four questions about any tool call, at any moment, with evidence attached. Who called. What was allowed to happen. What crossed the gate, and what got shielded on the way out. And what it cost. The answer to those four questions is the control plane we ship as twelve surfaces: eight that tell you what is happening, and four that decide what is allowed. Everything below is what the platform does today. The numbers are the numbers the system enforces or reports, not the ones I would like it to be.
The moment agents stop talking and start acting
Incident response in the enterprise was quiet for years, because the things that broke were built by humans and changed slowly. A service has an owner, a changelog, a post-mortem, and a fixed population of callers. When the caller is a model, all of that evaporates in one design decision. The same agent can book a meeting in the morning, write code by lunch, and query a production database by afternoon. That is what agentic systems are for: one principal, many tools, and no memory of the boundary between them. The failure categories change with it.
Classic monitoring asks "did the request fail, and why." With agents you must ask four more questions, and each one has its own answer shape. Was the failure the agent's fault, because it sent a malformed request or looped on a broken tool? Was it the upstream service's fault, because the API it called returned a 500? Was it the platform's fault, because the gateway itself misbehaved? And, the one nobody asks until the finance team asks: what did all of that cost, per request, per connector, per agent, in dollars?
I have read enough incident reports, in this space and in mine, to know the answer pattern. It is almost always "we could not tell which agent did what, and we found out after the damage." A non-deterministic caller and a post-hoc log system are a terrible pairing. The log is a crime scene photo, and the suspect has already left the building. Governance is the architecture you build so that the suspect, the weapon, and the timestamp all get recorded at the moment of the act, not after.
What AI governance actually is
AI governance, in the sense this industry needs it, is the control plane that surrounds agent to tool traffic. It is not a policy engine in the traditional OPA sense, deciding at deploy time which rules a service gets. It is not RBAC, which decides which human can log in. It is not a SIEM, which correlates logs after the fact. Those systems were all designed for a world where the thing that acts is a person or a fixed pipeline.
What AI governance does is different, and it is worth being precise about. It decides, per call, whether an action by a non-deterministic principal is allowed to happen, on a machine, against a third party's system, under a budget. And it keeps, for every call, a receipt that answers who, what, and how much. The term "governance" is doing real work here, and it is not only a compliance word. Compliance is the output. The input is a control plane with two properties: attribution at identity granularity, and enforcement in-flight, before the call leaves your infrastructure.
In Vinkius that control plane is what we call AI Governance, and it is organized as twelve surfaces. Eight report surfaces tell you what is happening across the fleet of connectors your agents use. Four policy surfaces decide what is allowed to happen, and they are enforced in the runtime, in the path of the request, not in a dashboard you check on Mondays. The split is deliberate. A dashboard you cannot act on is theater, and a policy without a receipt is fear. You need both halves, and the product is the union of the two.
Why a gateway is the only place control can live
The architectural argument is short. Your agents do not call your upstream APIs directly. They call tools, and in Vinkius those tools are connectors, hosted MCP servers that every agent in the fleet reaches through a single gate. That gate is where the traffic has to be, so that is where the control has to live.
The client side is not a safe place to put this. Prompt level guardrails are fragile by construction, because the model can rephrase its way around a rule, and because a guardrail that lives in the prompt is one context window away from not existing. Provider side filters are not your data path, and you cannot hold a vendor accountable for your agent's behavior. Post-hoc analytics, the SIEM you bolt on later, are a record of what happened, which is useful, and too late to stop the thing that is happening right now.
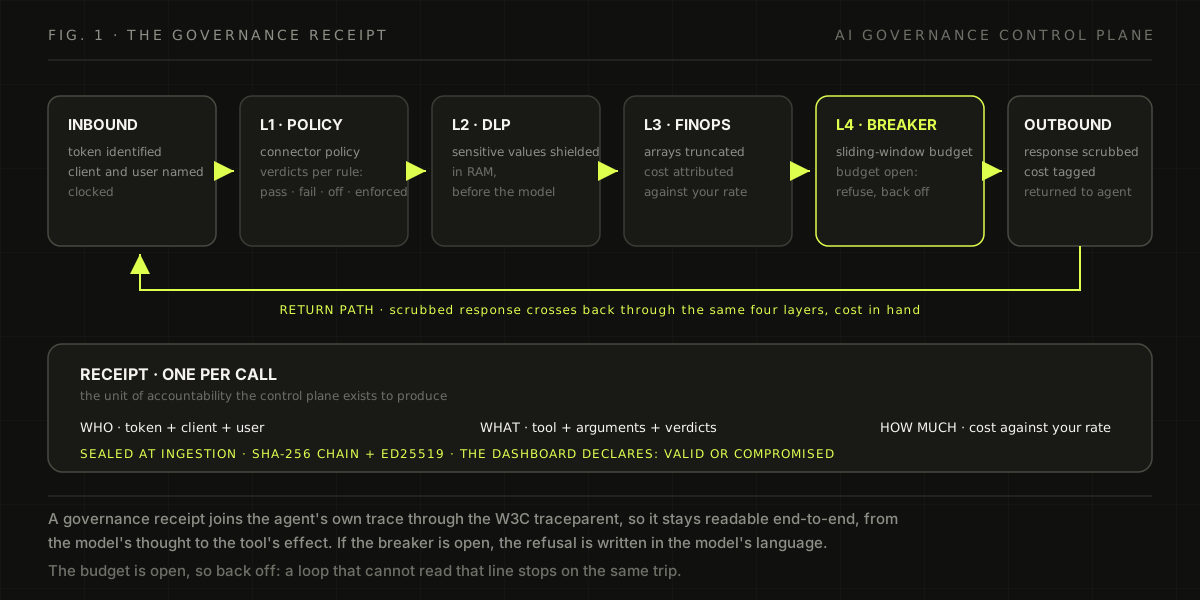
The gateway sees all of it at once: the request, the response, the token that authenticated the call, the connector it targeted, and the clock. That is the only point in the system where "who, what, and how much" is answerable with a single data set, and it is also the only point where a decision can still change the outcome. Every tool call in your fleet crosses the gate twice, inbound and outbound, and both crossings are where governance happens.
Two other pieces of the Vinkius platform make the gateway argument complete. Each connector runs inside its own sandboxed isolate, a design I wrote about separately in how Vinkius runs every MCP server in a V8 isolate, so that a hostile or broken tool can only ever act through effects the host owns. And since the 5.1.0 release of our open framework, the agent's distributed trace context is carried across the gateway, so every tool span parents to the caller's trace. That work is in the MCP Fusion 5.1.0 post on trace correlation, and it matters here because a governance receipt that cannot join the agent's own trace is a receipt nobody can read.
One honesty note before the tour: on the free plan the AI Governance dashboard opens with clearly labeled sample data. You explore the shape of the control plane before you commit to it. Live enforcement, the circuit breaker, and the emergency halt run on paid plans. I would rather say that plainly than let a reader assume the free tier does the paid thing.
Eight surfaces that tell you what is happening
The reports half of AI Governance is where I want to spend the most time, because this is the part enterprises test first, and the part where "we instrumented our agents" usually turns out to be a sentence about four dashboards and a prayer.
Mission Control
The top surface is the KPI strip for the whole fleet: total requests, average latency, a reliability figure we call Vinkius Reliability, total tokens moved, the count of values protected by data loss prevention, and the estimated cost saved by the FinOps guard. Below it sits a 30-day activity heatmap of agent behavior across the month, a request volume and latency chart, and an AI Briefing: a language-model-generated digest of what changed in your traffic this period. It is the one deliberately non-deterministic surface in a deterministic control plane, and it is a paid feature, because the briefing is a model call. One detail I insist on: the reliability figure you see excludes Vinkius's own errors. The number answers "how reliable is the fleet for you," not "how reliable is us." We do not count our mistakes against your uptime.
Agent Activity
The per-client view. Every connection token in your organization appears with its activity: who the client is, when it last called, how many requests it made. This is the surface that answers "which agent is doing what." An agent that should be running hourly and is calling every ninety seconds shows up here, and that is usually where a runaway loop is first noticed, before it becomes an invoice.
Connector Traffic
The same decomposition, per connector. Which of your tools is hot, which is cold, where latency concentrates. When one upstream provider degrades, this is the view that separates the provider's problem from your fleet's.
Access Tokens
The token fleet as an inventory. Status, last used, request counts. This one earns its keep in a way that surprises people: a connection token that has not been used in 90 days is a standing credential you issued and forgot about, and this surface exists to make that forgettability visible and actionable, with revoke and rotate one click away.
AI Spend
Cost, made legible. Estimated spend, the savings the FinOps guard measured, cost per request, the return on the FinOps policies, and a ledger broken down per connector. The guard attributes cost with a per million token rate you set, and the default is $3.00 per million tokens. The point of the surface is not to bill you. It is to show which agent, on which connector, is consuming what, because agent spend is not shaped like any cost you have charted before. It is not per user and it is not per request. It is per thought, and it compounds with every retry a loop adds.
Capability Reliability
Reliability at the level of the tool, not the service. Each capability a connector exposes has its own latency and failure behavior, and the Tool Health Matrix plots them together: latency against failure rate, one bubble per tool. A connector can be perfectly healthy while one specific tool inside it is quietly failing. That is the difference between monitoring a product and monitoring the thing your agents actually touch.
Security Posture
Two time series and one donut. The time series track how much data the DLP layer has shielded and how much the FinOps layer has truncated, over time. The donut is Compliance Coverage: the share of active governance policies across your fleet, counted per category, DLP, FinOps, and approvals. It is the number a reviewer wants to see, and it is computed from policy state, not from a questionnaire you fill out.
Request Failures
The error timeline, split into three buckets: Agent errors, where the caller sent something the tool could not honor, Upstream errors, where the third party behind the connector failed, and Vinkius errors, where we failed. This is the failure attribution the opening of this post was about. When a call fails, you are told whose failure it was, in the same view, in the same period, without a meeting.
Request Detail: the receipt
Drill into any single request and you get the unit of accountability the whole control plane exists to produce. The receipt names the identity that made the call: token, client, and the human or app user behind it. It lists the policy in force at that moment, rule by rule, grouped by the phase of the request lifecycle each rule belongs to, with the verdict of each: pass, fail, off, or enforced. It shows the audit trail entry for the call, sealed at ingestion into the hash-chained ledger we cover below. It shows trace continuity, the W3C trace context that joins this call to the agent's own distributed trace. It breaks the latency down into time the upstream API took versus time the governance layer added, so you always know the cost of the control plane itself. And it ends with actions: block a capability for every caller, or, on Business tier, an emergency halt of the connector. One request, one screen, the whole story.
Four surfaces that decide what is allowed
Connector Policy
The first policy surface is about how a connector is introduced to your fleet. Deployments can require approval before they are live, and the setting is framed around the four-eyes principle that the EU AI Act expects of high-risk systems under Article 14(5): a single person does not decide, by themselves, that a new tool with real consequences reaches the agents. The same surface controls how capabilities are exposed to the model, flat or grouped, with an automatic grouping threshold when a connector's tool list gets long, because what the model sees is a surface area, and surface area is a design decision.
And then there is the danger zone, which I would rather you understand than discover. The Global Emergency Halt stops every active connector in your organization. It deactivates all of them, revokes every token, and terminates every open session, in one synchronous action, and the confirmation requires typing HALT ALL, because this is the button you press when something has gone badly and you would rather the whole fleet be dead than wrong. After a halt you can restore, but the revoked tokens stay revoked. You reissue them deliberately. That is a design decision I want to be explicit about: recovery is a new trust relationship, not a replay of the old one.
DLP Protection
Data loss prevention, made for the model path. You name patterns for sensitive fields, an email anywhere in the response tree, a credit card number, a field at a specific path you decide to protect, and the runtime enforces them on the outbound path, shielding the value before the response reaches the agent. The shielding happens in memory, in the path between the upstream and the model, which is the difference between data that was masked and data that was never in the model's context. The KPI you see on Mission Control, DLP Protected, counts the redactions per period, so the layer is not just there, it is measured.
FinOps Guard
Cost guardrails, for the reasons explained in the AI Spend section. The guard does three things. It truncates arrays beyond a maximum item count, because a response that returns ten thousand records is a token bill, not an answer. It compresses the tool descriptions the model reads before it acts, the Toon compression setting in the dashboard. And it attributes cost with the rate you set, so the guard tells you, per period, how much it saved, in bytes and in dollars, against the rate. The output is not a bill. It is a measure of the gap between what the tool returned and what the agent needed, which is the number that decides whether your agent can keep calling this tool at all.
Circuit Breaker
A sliding-window request budget per connector, with a default of 5,000 requests every 5 minutes and a 15-minute cooldown, numbers you can tune. When a connector's budget is exceeded, the breaker trips, and the trip does something most guardrails never do: it tells the agent, in a machine-readable refusal written for a model, that the resource is open and that it should back off. A good agent respects that. A loop that cannot read the refusal gets stopped by the same trip, which is the point. The breaker state is shared across the fleet of gateway instances, so a budget is a budget, not a per process limit that resets when traffic moves. After the cooldown it can reset automatically, or you approve resumption from the dashboard. The breaker is what keeps one runaway agent from taking a third party's API, and your own bill, with it.
The foundations: scoped tokens, a sealed vault, a chained ledger
The twelve surfaces sit on foundations, and the foundations are where a lot of "governance" products are actually thin.
The identity layer is the connection token. Each connector has its own tokens, generated per organization, shown once, signed, and scoped to that connector only. A token for the email connector cannot touch the payments connector. Every receipt names the token that made the call, so identity is not a theory, it is a column in the audit data.
The secrets layer is the vault. Connector credentials are encrypted at rest with AES-256, and the guarantee we make is that not even the platform's own operators can read them at rest. They are injected into the execution environment only at runtime, in the isolate where the tool code runs, and the agent never sees the secret. That separation is the one I think about most when I design: the thing that decides, the model, and the thing that proves authority, the credential, should never share a context. A model that can read your upstream password is not a governance problem you can audit away. It is the problem.
The audit layer is the ledger. Every request hash is sealed at ingestion, and the ledger is hash-chained: each record carries the previous hash and its position in the sequence, and the chain is signed, SHA-256 with Ed25519, so a tamper is not a privacy issue, it is a detectable event, and the dashboard tells you the chain is valid or compromised. The deployment audit is structured around GDPR Article 73, the data subject's right of access, so when a regulator or a customer asks for the full history of a connector, the answer is a single exportable, verifiable chain, not a project.
And one layer more, the one I am proudest of. Some of the connectors in our marketplace are monitored decoys. They look like real tools. They are not, and they are watched. When a decoy is touched, the platform quarantines the tool, revokes the token, kills the open connections, and freezes the payout path, automatically. If a tool goes rogue, or a token leaks into the wild, the containment does not wait for you to notice.
Underneath all of it, the organization layer: single sign-on, custom roles and teams, service accounts for the non-human identities that run in CI and OIDC workloads, organization-level API keys, and a security audit log for the actions on the organization itself. The control plane sits on top of an identity model that knows the difference between a person and a machine, which is a difference every one of the twelve surfaces relies on.
What governance changes for the agents themselves
Most of the conversation about agent governance treats the agent as a risk to contain, and I am not going to pretend otherwise, because it is. But the other half of the argument is the one I would put on the sales deck: governance is what turns an agent from a demo into a worker.
Trust is granted in proportion to evidence. An operator will hand an agent the night shift, the production query, the payment reconciliation, in direct proportion to how well every action it took can be attributed, budgeted, shielded, and verified after the fact. The receipt is not a burden on the agent. It is the credential that gets it the bigger room.
The envelope of a governed agent is knowable. A deterministic policy around a non-deterministic model is the only sane shape for production: the model plans inside a box, and the box is stable. The circuit breaker's refusal is written in the model's language, so the agent learns the budget, and respects it, instead of discovering it in the form of a bill. The truncation in the FinOps guard means the model gets a sized answer instead of a 200-kilobyte blob, which is an intelligence problem, not only a cost one.
And the agent itself gains the capability that no autonomous system has ever had in practice: it can show its work. For an agent that will operate in regulated workflows, the audit trail is not overhead, it is the product. The governed agent is the only kind of agent you can give real authority, and the ungoverned agent is, forever, a demo.
Observability that finally speaks the language of agents
If your team already runs Datadog or Grafana, the shape of the AI Governance surfaces will feel familiar, and that is intentional. KPI strips, heatmaps, drill-downs, per request receipts. What is not familiar is what agent traffic does to the model those tools were built on.
Datadog measures a world where the callers are systems that someone wrote. The workload has a fixed shape, cost scales with users or requests, and a failure has one responsible party. Agent traffic breaks all three assumptions at once. The caller is probabilistic. The workload is shaped by thinking, and a retry loop multiplies it. And a failure has three candidate owners, agent, upstream, platform, which is why the failure timeline splits into three buckets instead of one.
So the control plane for agents is observability with an enforcement layer, and the enforcement layer is what Datadog, built for a human-built world, does not have. Every tool call is attributed to an identity, cost is attributed at token granularity, failures are attributed to a responsible side, and the policy layer acts in-flight, before the call leaves the gate. That is the elevation I wanted in this post: take the instrumentation discipline of the platforms you already trust, and add the two properties agent systems need, per-call attribution and in-flight enforcement. The result is not a new category of tool. It is the same category, at the resolution agent systems require.
Frequently asked questions
Is AI governance just RBAC with extra steps?
No, and the difference is the unit of decision. RBAC decides which human, with which role, can reach a system. It is a gate on identity, evaluated once. AI governance decides what an action, taken by a non-deterministic principal through a specific tool, is allowed to do, on every call, under a budget, with the answer recorded. One is a door. The other is a traffic court for the actions your agents take.
Does Vinkius read my agents' prompts?
No. The gate sees the tool call: the tool name, the arguments it sent, the response it received, the identity behind it, and the clock. The four policy surfaces are deterministic rule and budget layers, not a language model judge. If you want the model to inspect the model, that is a different product, and I would not call that governance, I would call it a second opinion.
What happens when the circuit breaker trips?
The connector's traffic is refused with a machine-readable notice that tells the agent the budget is open and that it should back off, for a cooldown period. After the cooldown the breaker resets on its own, or an operator approves resumption from the dashboard. The state is shared across the gateway fleet, so the budget holds regardless of which instance serves the call. The session layer that keeps the swarm in check is the subject of the SwarmGateway sessions post.
Can I export and verify the audit chain?
Yes. The deployment audit exports as a document, and the chain is verifiable end-to-end: every record carries the previous hash and its position, the chain is signed, and the dashboard states whether the chain is valid or compromised. It is structured around GDPR Article 73, so a data subject's access request maps onto one artifact.
What do I get on the free plan?
The full dashboard, with clearly labeled sample data, so you can learn the shape of the control plane. The live enforcement, the circuit breaker, and the emergency halt are on paid plans, and the AI Briefing is a paid feature. I would rather be the vendor who tells you that in a blog post than the one who makes you discover it in the pricing page.
The control plane is the product
The gap between the agent demo and the agent you would let act while you sleep is not the model. It is the control plane. Twelve surfaces, eight that tell you and four that decide, sitting on scoped tokens, a sealed vault, a chained ledger, and a decoy layer that contains the damage before you do. Every call gets a receipt, and the receipt answers who, what, and how much, in the order a regulator, a finance team, or a 3 a.m. page would ask them.
If your agents are already acting on your systems, the question is no longer whether you can afford governance. It is whether you can afford the day you find out you do not have it.
For a deeper account of how Vinkius built the runtime that makes this governance possible for AI agents, see AI Agents Are the New Consumers.
The twelve governance surfaces defined here are enforced with source code and line numbers in Enterprise AI Questions.